Abandoned Cart Conversion Rate: How to Lift It
A single recovery rate can flatter a store. Abandoned cart conversion rate is recovered orders divided by abandoned carts. The familiar abandonment figure is not a recovery benchmark.
The rate also hides intent. A shopper who added one item and left is not the same as a shopper who reached checkout and stalled. Split those groups before you judge an SMS flow. Clicks show interest, not completed orders. Measure completed orders from checkout abandoners against carts that had a real chance to convert.
Table of Contents
- What Abandoned Cart Conversion Rate Actually Measures
- Benchmarks by Device Category and Region
- How to Calculate the Rate on Your Store
- Why Shoppers Leave Before Paying
- Recovery Moves That Raise Completed Orders
- A Worked Example From Clicks to Margin
- Launch the First Recovery Text This Week
What Abandoned Cart Conversion Rate Actually Measures
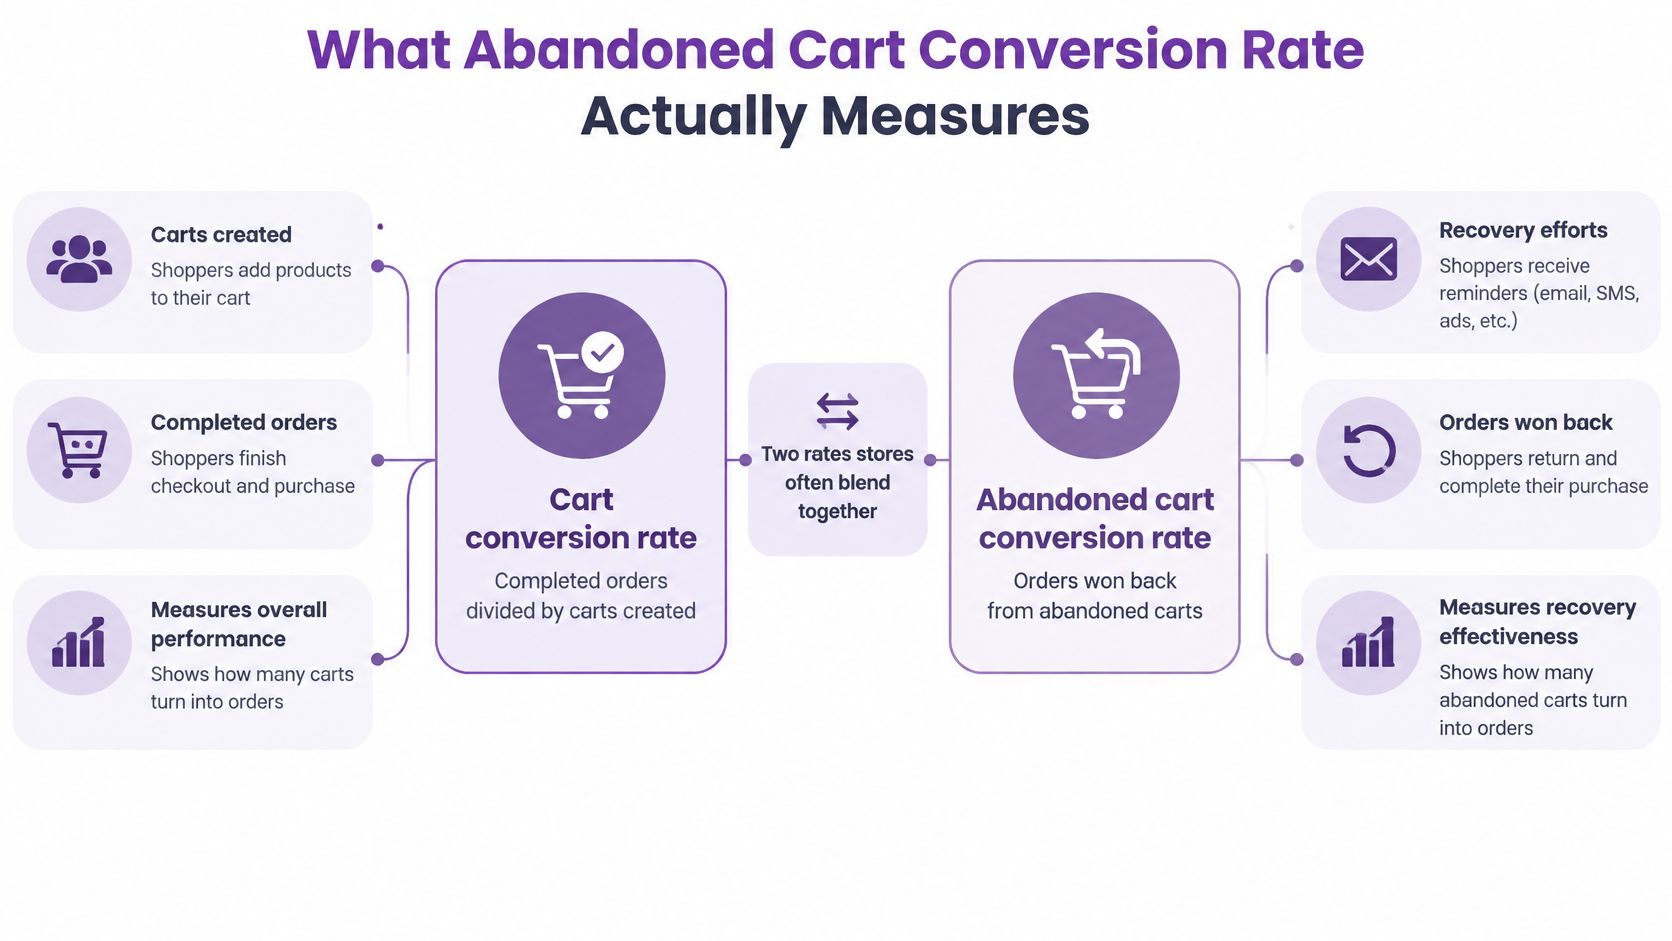
Two rates often get blended together. Cart conversion rate measures completed orders against all carts created. Abandoned cart conversion rate, when used as a recovery metric, measures orders won back against carts that didn't originally result in an order.
For example, say your store creates 10,000 carts in a month and completes 3,000 orders. Its cart conversion rate is 30%, and about 7,000 carts are abandoned. If a recovery campaign brings back 5% of those abandoned carts, that's roughly 350 additional orders, before accounting for average order value, margin, or repeat purchases. This is an example of the arithmetic, not a promise that a campaign will achieve that recovery rate.
Recovery rate = orders won back ÷ abandoned carts × 100
Abandonment isn't the same as a homepage bounce. The shopper has typically selected at least one item and moved further into the buying journey. But that doesn't mean every abandoned cart was a likely sale waiting for a text. Some shoppers are researching or comparing prices; others begin checkout and encounter an obstacle.
Baymard's US shopper research found that 42% of shoppers had abandoned a cart because they were only browsing or weren't ready to buy. Those shoppers shouldn't automatically be counted as failures of your checkout or as sales an SMS could have saved. To separate those cases, track three groups from day one: add-to-cart only, checkout started, and payment failed. For a clearer distinction between these events, see cart abandonment versus checkout abandonment.
The table below puts the famous global figure in context. An abandonment benchmark is not a recovery benchmark and shouldn't be treated as a quota for one Shopify store, device, or category.
Benchmarks by Device Category and Region
A benchmark works like a smoke alarm. It tells you where to look, not what your target should be. The familiar global abandonment headline mixes casual browsers with shoppers who reached checkout and then hit friction. These device and regional ranges carry the same limitation. Use them to set expectations for a segment, then judge your own recovery against checkout-started carts, the group a text can still influence.
| Segment | Abandonment rate | Reading | Best use |
|---|---|---|---|
| Skincare mobile, Q3 2024 | 81% | About 810 of 1,000 baskets lost | Phone shoppers in a visual category |
| Skincare computer, Q3 2024 | 69% | 12 points lower than mobile | Desktop comparison for the same category |
| Mobile commerce broadly | About 80% | Higher friction on small screens | Separate mobile reporting |
| Desktop broadly | About 69% | Lower than mobile, still high | Do not blend with phone carts |
| Asia-Pacific | About 82% | Highest regional band cited | Localize duties, currency, and delivery |
| EMEA | About 79% | Above the Americas | Check cross-border promises |
| Americas | About 75% | Still far from full completion | Regional context, not a goal |
The device comparison for skincare shows why one storewide average can hide useful patterns. Statista's third-quarter 2024 skincare figures put mobile abandonment at 81%, compared with 69% on computers, a 12-percentage-point gap. That is about 810 out of every 1,000 mobile baskets that did not produce an order, versus about 690 computer baskets.
Those figures show different outcomes. They do not prove why the gap exists. A mobile shopper may face small-screen forms, payment authentication, a delivery-cost surprise, or difficulty returning to checkout after getting interrupted. Check your own funnel before deciding which problem to address. If mobile shoppers click your reminder but do not complete checkout, test the mobile destination and checkout experience, not just the message wording.
The regional and broad device figures offer additional comparison points. Shopify's checkout guidance reports broad abandonment summaries of about 80% on mobile and 69% on desktop, with rates near 82% in Asia-Pacific, 79% in EMEA, and 75% in the Americas (Shopify's checkout optimization guidance). Use those ranges to ask questions about your own audience. They are not a grade for a store in an unrelated market.
A US desktop apparel cart should not be judged against an Asia-Pacific mobile cart. These figures describe abandonment. They say nothing about how many abandoned carts a text can win back. Segment results by device and product category before calling a recovery flow successful or unsuccessful.
How to Calculate the Rate on Your Store
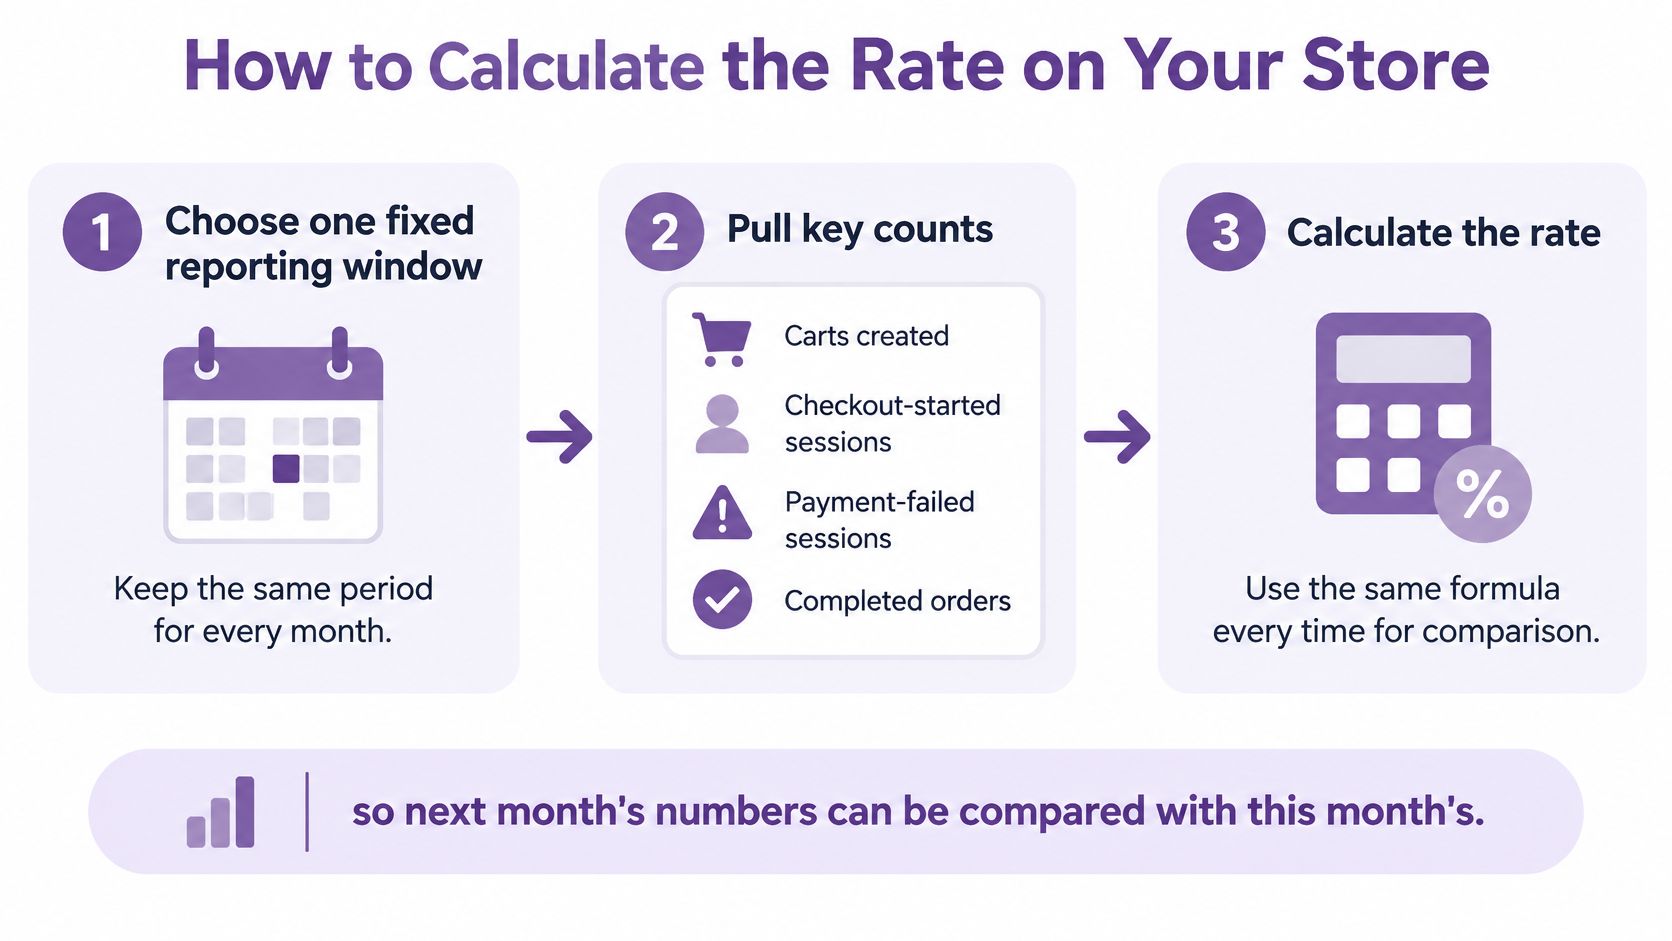
A useful store rate depends on consistent counting. Choose one reporting window, apply the same rules to every cart in it, and keep those rules unchanged when you compare periods.
Pull the same counts for the same window. Gather carts created, checkout-started sessions, payment-failed sessions, and completed orders. A fixed 28-day reporting period is one practical monthly choice.
Set a consistent abandonment rule. Count a cart as abandoned only if it contains at least one item and no order arrives within your chosen window. You might use 24 hours, but the important thing is to apply the same cutoff each time.
Split the abandoned carts by intent and stage. Keep add-to-cart-only, checkout-started, and payment-failed carts separate. Calculate recovered orders for each group against its own abandoned-cart total. That lets you see whether a flow is helping shoppers who reached payment without treating casual product interest as equivalent.
Deduplicate later purchases. A shopper might receive a text and then complete the order through email, on another device, or on a later visit. Count that order once, using a consistent attribution rule.
Track value, not just order count. Attach revenue and contribution margin to each recovered order. A campaign can add orders and still perform poorly if discounts and message costs consume too much of the margin.
Build a repeatable scorecard. Record carts created, abandoned carts, recovered orders, recovery rate by slice, and revenue per recovered order. Compare the result with your own prior period, not with a published abandonment figure. The available benchmarks describe abandonment, not a universal recovery-rate target.
The global abandonment benchmark can help explain why the problem matters, but it won't predict your store's recovery results. Statista's worldwide e-commerce checkout data places overall abandonment at approximately 70%, or roughly seven out of every ten shopping carts. Its example of 10,000 carts at that rate yields about 7,000 abandoned carts and 3,000 completed orders. Keep your reporting window and deduplication method fixed, or a change in the scorecard could reflect changed counting rather than changed store performance.
Why Shoppers Leave Before Paying
The first diagnostic question is whether the shopper was ready to buy. Baymard's US shopper research found that 42% had abandoned a cart because they were only browsing or weren't ready to purchase. That's different from a failed payment or a checkout that won't load.
For other reasons, Baymard reports the following shares among non-browsing abandonment reasons. They're not added to the browsing figure, because they describe a different group of reasons.
| Reason | Share | How the share is counted | First fix |
|---|---|---|---|
| Browsing or not ready to buy | 42% | US shoppers who abandoned | Report separately; don't discount by default |
| Extra costs such as shipping, tax, or fees | 40% | Non-browsing abandonment reasons | Show the total earlier and repeat it in the reminder |
| Delivery too slow | 20% | Non-browsing abandonment reasons | State the delivery window in the message |
| Low trust with card details | 19% | Non-browsing abandonment reasons | Reassure shoppers about site security; never ask for a card by text |
| Checkout too long or complicated | 17% | US online shoppers | Reduce form fields, often by 20% to 60% |
| Forced account creation | 18% | US online shoppers | Offer guest checkout |
| Preferred payment method unavailable | 9% | US online shoppers | Add the wallets used in that market |
The first four rows distinguish intent and common purchase objections. The extra-cost, slow-delivery, and card-trust figures come from Baymard's US cart abandonment findings. The checkout-specific rows identify places where the store itself can reduce friction. Baymard reports that 17% of US online shoppers abandoned an order because checkout was too long or complicated, 18% because they were forced to create an account, and 9% because their preferred payment method was unavailable. Its checkout usability research also indicates that many checkouts can reduce their default form elements by 20% to 60% (Baymard's checkout usability report).
Use the likely objection to choose the first test. If shoppers see shipping costs late, make the total clearer earlier and include that information in a reminder when it's already available. If the checkout asks for too much, trim unnecessary fields and provide guest checkout. If shoppers don't trust the payment step, add clear site-security reassurance. For practical ideas on lowering delivery expenses and making shipping costs easier to manage, see this guide to cut courier expenses for your business.
A discount won't fix a slow checkout, a missing payment option, or an unexpected delivery fee. Reserve stronger offers for higher-intent groups, such as shoppers who reached payment and then left. If the session never reached checkout, don't treat it like a failed payment.
Recovery Moves That Raise Completed Orders
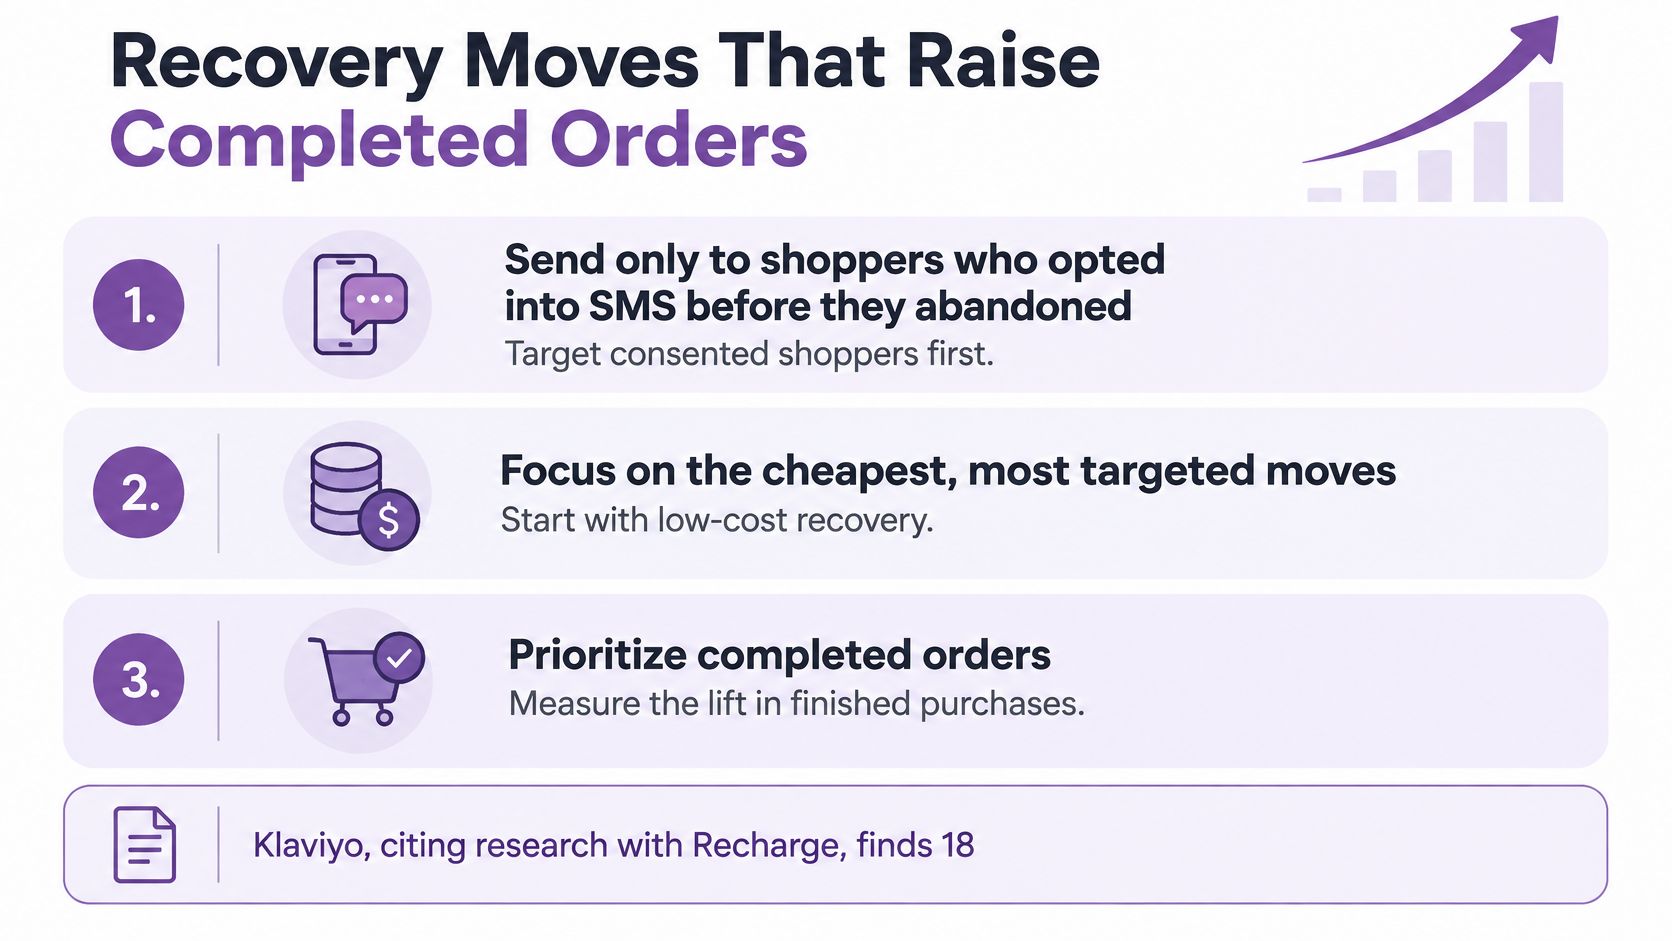
Start with the smallest, most targeted audience you can identify. Klaviyo, citing SMS research conducted with Recharge, reports that 18% of customers prefer abandoned-cart notifications by SMS (Klaviyo's SMS marketing overview). That supports offering an opt-in text flow, not texting every person who leaves a cart.
Set up the audience and destination first
Collect explicit SMS consent before the cart is abandoned, and retain the consent status and source. Trigger recovery only for consented subscribers with an identifiable cart who haven't purchased since opting in. Then make the link go to the saved cart or checkout, not the homepage. Confirm that the destination supports guest checkout and the payment methods shoppers need.
Make the message answer a question
A useful reminder names the product and price. Include shipping or delivery details only when those details were already displayed at checkout. Start with a simple reminder, then consider an incentive later for eligible non-buyers in a higher-intent group.
For example: “Still considering the [product name]? Your cart is ready when you are.” If the checkout already showed a delivery window, the message can state it plainly. Don't manufacture urgency or promise a saving unless the offer is real and available to that shopper.
A practical starting sequence is a first reminder within a few hours, another the next day, and a final message within two days, then stop. Change only one variable at a time, such as timing, copy, audience, or incentive. That makes it easier to understand what changed the result.
Measure incremental orders, not just response
Compare eligible, consented recipients with a holdout group that doesn't receive the recovery text. Track recovered orders, revenue per recipient, unsubscribe rate, and profit after message cost. You can also test SMS against email or a coordinated email-plus-SMS journey, because stated channel preference isn't a conversion guarantee.
Keep sample messages direct and specific: “Is the blue jacket still on your mind?” or “Your saved cart is ready to finish.” Use a savings message only if the discount code is valid and the recipient qualifies. For more campaign ideas, explore these strategies for recovering abandoned carts and review abandoned-cart SMS examples.
A high click count isn't the aim. The aim is more completed orders at a margin that makes the recovery worthwhile.
A Worked Example From Clicks to Margin
Say a Shopify store sends one reminder to 1,000 consented abandoned carts. Klaviyo's published 2026 abandoned-cart benchmark reports an average click rate of 10.3% for abandoned-cart texts (Klaviyo's abandoned-cart benchmarks). At that rate, roughly 103 people click. That's a measure of message engagement, not completed orders.
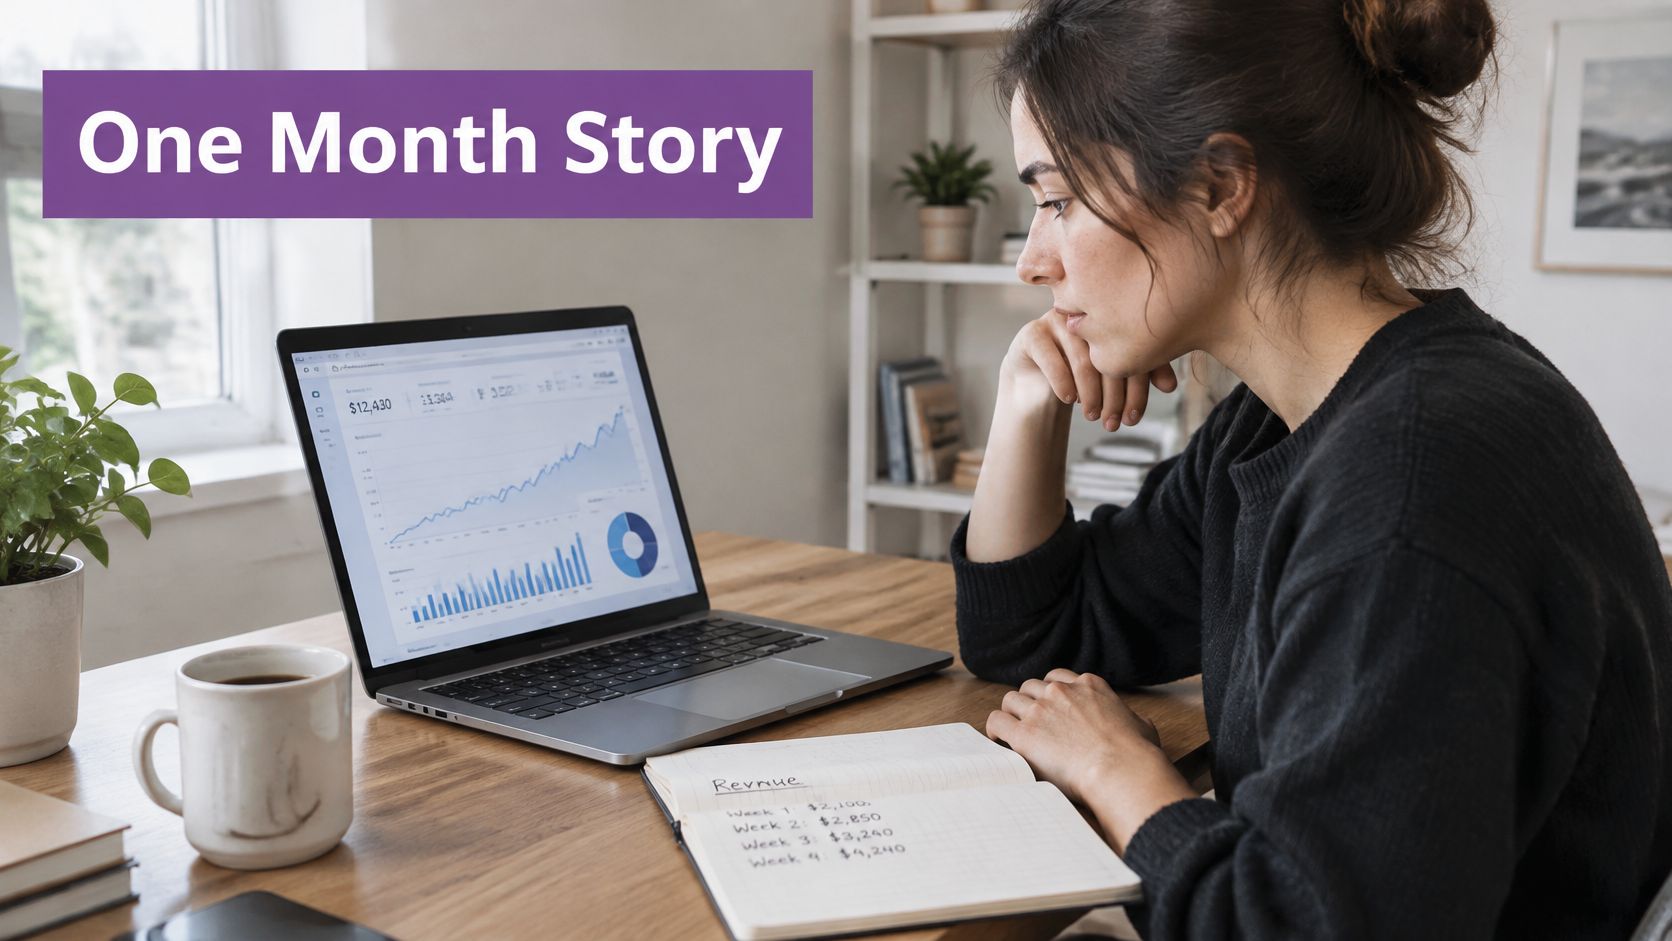
Now add a hypothetical checkout assumption. If one in four clickers completes the purchase, the store recovers about 26 orders. At an $80 average order value, that's about $2,080 in recovered revenue before discounts, message costs, and returns.
| Stage | Value | Basis |
|---|---|---|
| Consented abandoned carts | 1,000 | Starting pool |
| Clicks | About 103 | 10.3% average click rate |
| Recovered orders | About 26 | One in four clickers finish checkout |
| Recovered revenue | About $2,080 | 26 orders at $80 average order value |
| Discount cost if a 15% code applies to all | About $312 | 15% of recovered revenue |
The conversion from clicks to orders and the average order value here are scenario assumptions, not published benchmarks. The discount calculation shows the trade-off: a 15% code applied to all recovered revenue removes about $312 before text costs. If some recipients were casual browsers who would have bought later without a code, the store gives away margin without gaining an incremental order.
Next, split those same carts by checkout stage. If a smaller checkout-started group converts at a higher rate, a blended recovery rate of about 2.6% across all 1,000 carts would hide that difference. Track each slice separately so you can decide where the reminder is doing useful work.
A holdout helps answer the question clicks can't: would those shoppers have purchased without the text? If the holdout group completes almost as many orders, the flow may not be earning its cost. The measurement chain should run from delivered texts to unique clicks, recovered checkouts, completed orders, revenue, and contribution margin. Use unique trackable checkout links and deduplicate orders completed through another channel.
Here's the video for another look at measuring a recovery funnel:
Keep the comparison focused: contribution margin on recovered orders minus message cost and discounts, alongside unsubscribes. A 10.3% click rate can still describe a weak program if checkout completion or margin is poor.
Launch the First Recovery Text This Week
Before sending anything, confirm three gates: SMS consent is stored with its source, the link opens the shopper's saved cart, and your reporting counts recovered orders separately from clicks. If you collect phone numbers at checkout or through a popup, make consent status available to the flow and suppress subscribers who've already purchased. Use this SMS compliance checklist to review your consent process.
Then set up the cart flow in the SMS platform your store uses. For Shopify merchants, YipSMS is one option: installation takes one click on Shopify, and a first Scratch-to-Win popup and abandoned-cart automation can be launched in under 10 minutes. The flow sends follow-ups at 2h, 24h, and 48h, with real-time analytics for delivery, failures, clicks, and conversions.
Start with a non-discount reminder to consented, high-intent carts and keep a holdout group. Add a code only to a later message for shoppers who still haven't purchased. Check deliveries and failures the next day, then judge your first 28-day window by recovered orders and margin, not clicks.
Turn on the three-message cart flow with a holdout, then review the scorecard in four weeks.
YipSMS Inc. offers Shopify-connected SMS marketing, including abandoned-cart and checkout automations, direct recovery links, and real-time conversion reporting. Visit YipSMS Inc. to see whether its tools fit your store's recovery workflow.
How this article was made: the YIPSMS team drafts some articles with AI writing tools, then checks pricing, compliance and product details against how YIPSMS actually works before publishing. Spotted something wrong? Tell us through your YIPSMS account.