Abandoned Cart Benchmarks for 2026: Rates, Recovery and SMS
Only about three in ten online carts become orders. Baymard Institute's 14-year tracking of ecommerce checkout behavior, as summarized by Statista, puts the global average at 70.19%. That figure reframes abandoned cart benchmarks. A rate near 70% has held for more than a decade, so it describes how people shop online, not a one-off bug on a single store.
The useful question isn't whether you beat a blended average. It's which exit you measured, why the shopper left, and whether an SMS recovered an order that wouldn't have happened anyway. A holdout group is the only honest judge of that last part.
Table of Contents
- Abandoned Cart Benchmarks at a Glance
- Measure Your Own Abandonment Rate
- How to Compare Your Rate Against Benchmarks Fairly
- Why Shoppers Leave and How Often Each Reason Appears
- Where SMS Fits Among Recovery Channels
- What Recovery Rates to Expect
- Set Your Recovery Target and Test SMS Against a Holdout
Abandoned Cart Benchmarks at a Glance
Treat 70.19% as the headline baseline, not a score you must hit. At that average, roughly three in ten initiated carts become completed orders. Checkout design often sits inside the loss: confusing fields, extra steps, and a flow the shopper can't finish all push people out before payment.
| Benchmark | Value | What it measures | How to use it |
|---|---|---|---|
| Global cart abandonment rate | 70.19% (Baymard, 14-year tracking) | Share of initiated carts not purchased | Directional baseline, not a target |
| Completed-order share | About 30% | Carts that become orders at the global average | Compare with your own completion rate |
| Scale at 10,000 cart creations | About 7,019 abandoned, 2,981 completed | Size of the recoverable pool | Turn rates into order counts |
| Abandoners citing extra costs | 40% to 48% | Shipping, tax and fee surprise | Prioritize cost transparency before SMS |
| Customers preferring SMS alerts | Nearly 18% | Preference for text cart notifications (Klaviyo) | Plan SMS as one channel, not the only one |
| Revenue per recipient, automated flows | Up to 30x one-time campaigns | Vendor-reported (Klaviyo) | Confirm with a holdout before budgeting |
Read the rows as a reference card, not a promise. A store with 10,000 cart creations would, at the global average, see about 7,019 abandoned carts and 2,981 completed purchases. That's the size of the pool, not the number of orders a text can win back. The 40% to 48% cost row is a reason people give, not a slice you can add to the other rows. The SMS preference and the up to 30x revenue-per-recipient figure are vendor-reported comparisons of timely automated flows against one-time campaigns. Neither is a recovery-rate target.
Why these numbers stay directional
These baselines mix definitions, devices, product categories, traffic sources, and funnel stages. A cart created by a browser who never meant to buy sits in the same average as a checkout that died on a shipping fee. Markets differ, and so does whether the cart was serious purchase intent.
Practical rule: Compare your completed-order share from the last 90 days with the 70.19% abandonment baseline before you compare anything else. If about 30 of every 100 carts become orders at the global average, your own completion share tells you whether you're near that line or far from it.
Use the other rows only after that comparison. Cost surprises point to checkout copy. SMS preference tells you to plan text as one channel. The revenue multiple tells you automated timing can beat a blast, and that you still have to prove the lift on your own traffic.
Measure Your Own Abandonment Rate
A shopper fills a basket, reaches the till, and may leave at the card reader. Each exit is a different problem, and a single abandoned cart benchmarks percentage hides that. Cart abandonment and checkout abandonment are not the same event. The often-repeated global figure near 70.19% blends studies with different definitions, traffic sources, devices, industries, and checkout stages, which is why Baymard's checkout usability benchmark is a poor denominator for an SMS report.
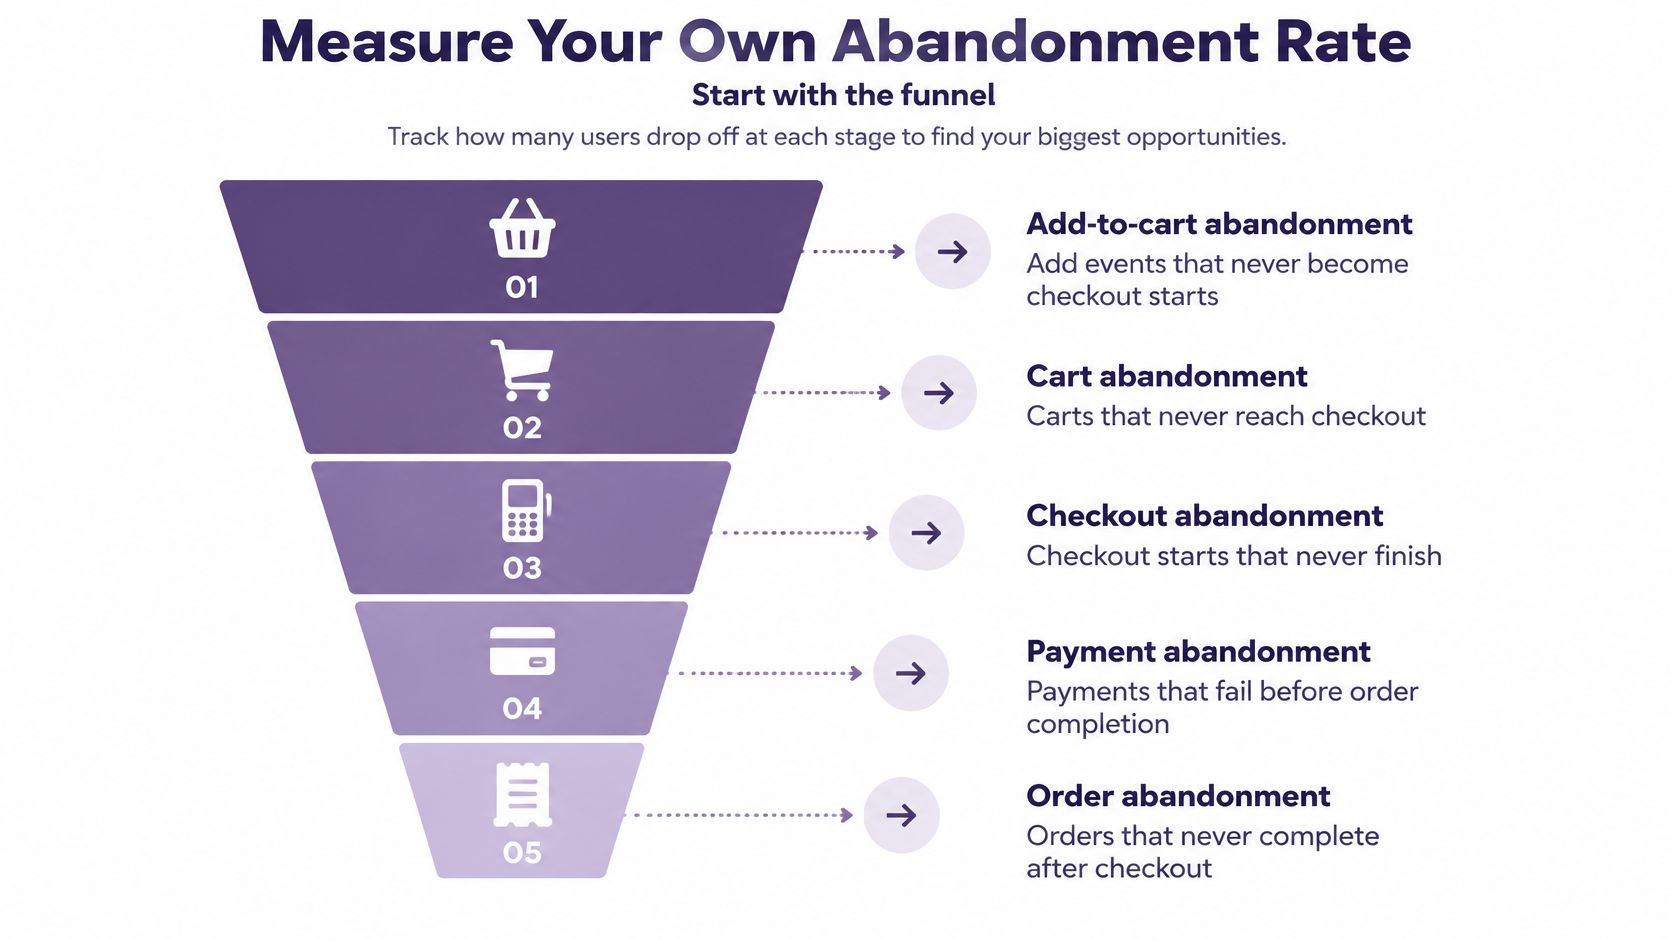
Shopify-style abandoned checkout reporting starts later than a cart event. The shopper must reach checkout and provide an email before an incomplete checkout counts as abandoned. A visitor who adds an item and never identifies themselves can't receive an ordinary recovery message. An identified checkout user can. If you need a plain definition before you pull reports, AdLibrarySpy's abandoned cart definition draws that line between a started cart and a paid order.
Five measures and what each one diagnoses
| Metric | Denominator | Numerator | Diagnostic use |
|---|---|---|---|
| Add-to-cart abandonment | Add-to-cart events | Events with no checkout start | Product page, price and cart appeal |
| Checkout abandonment | Checkout starts | Checkouts with no order | Shipping costs, forms, trust signals |
| Identified checkout abandonment | Checkouts with email or phone captured | Those checkouts with no order | Eligible for SMS and email recovery |
| Payment failure rate | Payment attempts | Failed attempts | Gateway health and payment method range |
| Recovery rate | Abandoned carts sent a message | Those later purchasing | Campaign effectiveness, needs a holdout |
Baymard's data shows that 42% of US shoppers abandoned because they were merely browsing or not ready to buy, while 17% cited a checkout that was too long or complicated. Those two groups don't want the same fix, and SMS can't reach the anonymous half of the first group at all. Comparing an app's recovered revenue with a 70% cart rate uses the wrong denominator.
Say a store logs 1,000 add-to-cart events, 400 checkout starts, and 250 orders. Add-to-cart abandonment is (1,000 − 400) / 1,000, or 60%. Checkout abandonment is (400 − 250) / 400, or 37.5%. Same week, two problems: the product page isn't pulling people into checkout, and a large share of people who do start checkout don't finish.
Calculate the rate you can act on
The arithmetic is short, and the splits are what make it useful. A step-by-step version of the same math is in this guide to how to calculate cart abandonment rate.
- Choose a date range of at least 30 days, and exclude a sale week if you want a normal baseline.
- Count checkout starts and orders from the same source, such as the orders export and the abandoned checkout report.
- Calculate (checkout starts minus orders) divided by checkout starts.
- Split abandoned checkouts into identified and anonymous.
- Split again by device and traffic source, and log the top three exit-survey reasons.
- Take payment failures from gateway logs, not the cart report.
Work a second example. Two thousand checkouts and 1,300 orders leave 700 abandoned, or 35%. If 500 of those 700 have an email or phone and 200 don't, report two rows. Only the 500 are eligible for a compliant reminder. The 200 are a checkout-UX problem, not a messaging problem.
The rate should move when the funnel changes. It shouldn't jump because you installed a new app or filtered the report differently from last month.
How to Compare Your Rate Against Benchmarks Fairly
A store-wide rate misleads because the people inside it don't behave the same way. Mobile checkouts, first-time shoppers, and anonymous visitors abandon for different reasons, so a blended number hides where the orders disappear. Fair abandoned cart benchmarks compare a segment with the same segment, not with a published average from a different definition.
Baymard's current checkout UX research shows how often the checkout itself is the leak. 62% of sites don't make guest checkout the most prominent option. 64% of leading ecommerce sites perform at a mediocre-or-worse level for checkout UX. The average checkout contains 11.3 form fields. On a phone, those fields, address entry, missing payment methods, and page errors do more damage than a late reminder. A strong recovery campaign can still be worth running, and it may recover fewer lost orders than removing friction before the text is sent.
Segments that change the rate
Mobile versus desktop. Small fields and a long form raise mobile abandonment even when desktop looks healthy. An illustrative split, not a published benchmark: a store at 38% blended abandonment might find 45% on mobile and 24% on desktop. That gap points to checkout layout, not to reminder timing.
New versus returning. First-time shoppers lack a saved address and a reason to trust the payment form. Returning shoppers often fail for a different reason, such as a changed shipping price or a payment method that no longer works.
Identified versus anonymous. Only checkouts with an email or phone can receive SMS or email. Anonymous abandonment is a measurement and UX issue. Messaging can't touch it.
Sale weeks versus normal weeks. A promotion changes both intent and shipping math. Comparing a launch week with a quiet week makes a healthy checkout look broken, or the reverse.
Before you trust a week-over-week move, identify bots using fingerprint and IP signals. Inflated add-to-cart events from scripts will make abandonment look worse than the human funnel is.
A fair comparison checklist
- Same device class: Don't mix mobile and desktop into one rate when the decision is about layout.
- Same funnel stage: Add-to-cart drop-off isn't checkout abandonment.
- Same identification status: Eligible recipients aren't the whole abandoned pool.
- Same traffic source: Paid social and email subscribers don't share intent.
- A clean date range: Drop sale events, outages, and half-days from the window.
A competitor's published rate is a fair comparison only when the definitions match. A placed-cart rate and a checkout-start rate can differ by a wide margin on the same store. Ask which denominator they used before you treat their number as a target.
Why Shoppers Leave and How Often Each Reason Appears
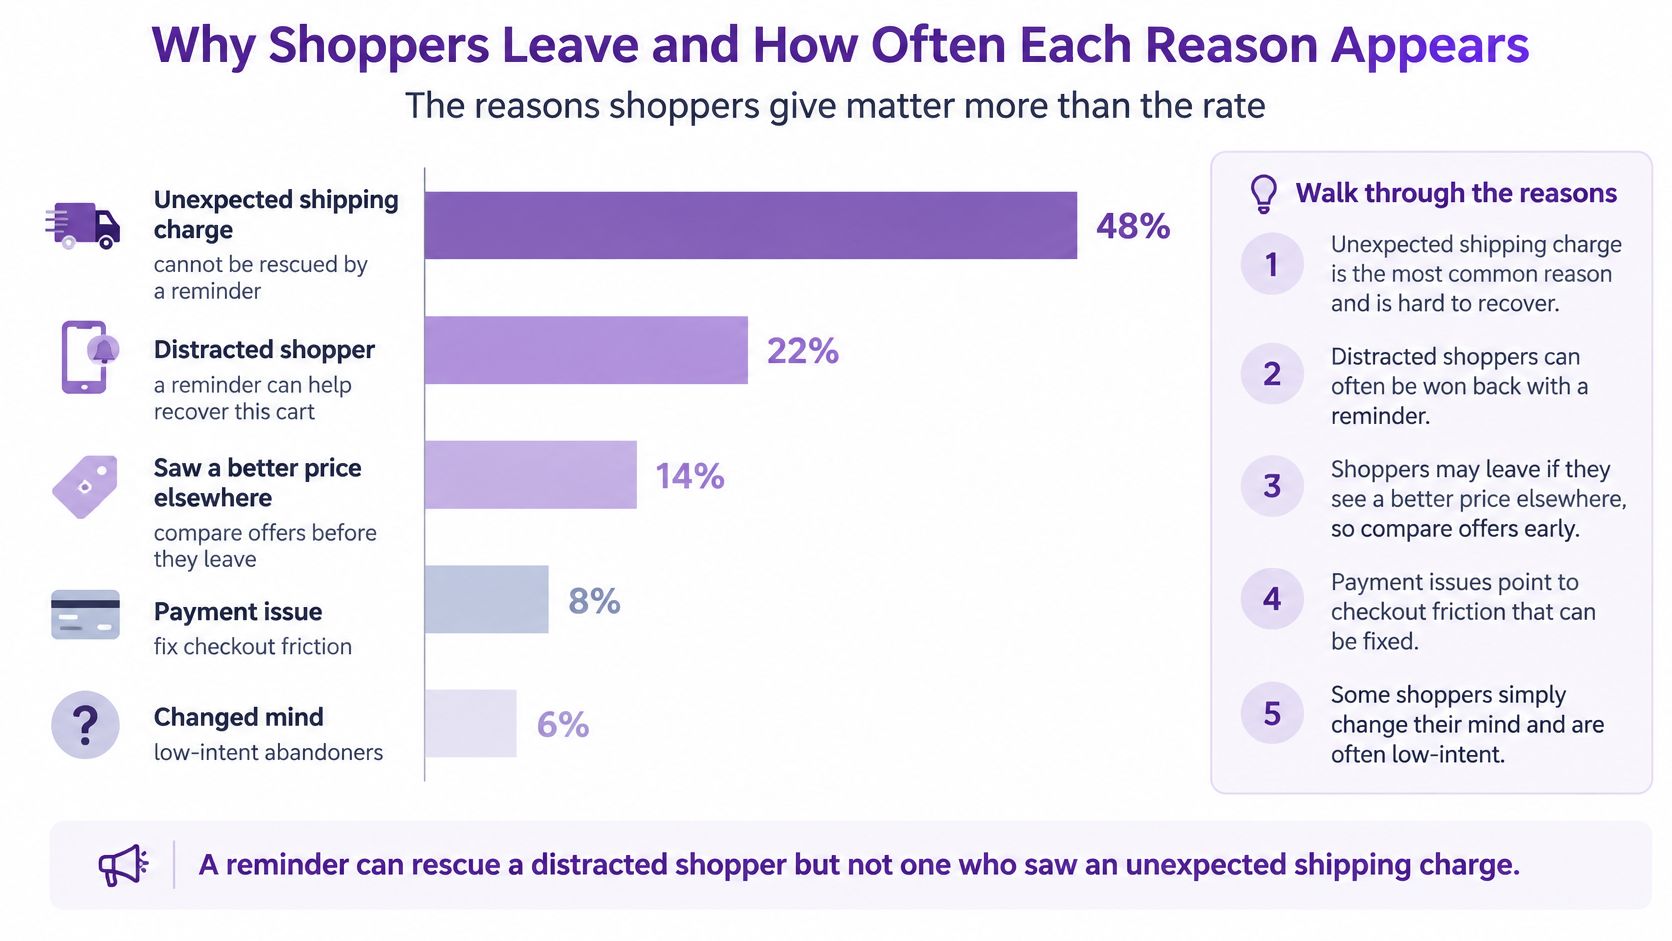
Cart abandonment and checkout abandonment point to different failures. A cart that goes quiet often means browsing, comparison, or waiting. A checkout that stops after shipping, payment, or account creation means the price or the process rejected the buyer. SMS can recover the first group with a nudge. It cannot fix the second group until the store removes the objection.
Match the reason to a fix
Baymard-related 2024 survey figures reported by Contentsquare put unexpected or excessive extra costs, including shipping, taxes, and fees, first at 48% of abandoned carts. The same survey set puts forced account creation at 26%, lack of trust with payment information at 25%, and website errors or crashes at 17%. These are survey shares, not additive probabilities. One shopper can cite several reasons, so the column can pass 100%.
| Reason | Share cited | Source | Matching fix |
|---|---|---|---|
| Unexpected extra costs (shipping, tax, fees) | 40% to 48% typical range | Contentsquare; Shopify summary | Show total cost earlier |
| Browsing or not ready to buy | 42% of US shoppers | Baymard | Nurture, avoid discounting |
| Account creation required | 26% | Contentsquare | Offer guest checkout |
| No trust in site with payment details | 25% | Contentsquare | Show security and payment cues |
| Delivery speed | 20% | Shopify summary | Show delivery window |
| Checkout too long or complicated | 17% of US shoppers | Baymard | Reduce form fields |
| Website errors or crashes | 17% | Contentsquare | Monitor checkout errors |
| Unsatisfactory returns policy | 13% | Shopify summary | Link returns policy in reminder |
Cost comes first. Show shipping, tax, and fees before the payment step, including the free-shipping threshold if you have one. Guest checkout removes the account wall for buyers who stop at registration. Trust cues, recognizable payment marks, and a visible security note address payment hesitation. Error monitoring catches crashes and broken forms. No message repairs those.
Browsers need nurture, not discounts. Discounting that group trains them to wait for the next code. Long checkouts need fewer fields and clearer delivery and returns terms on the page itself. Put delivery speed and returns policy in SMS only after the page states them clearly, because the text should repeat one resolved objection.
Once you know your top reason, prioritize tests after a CRO audit so the first experiment attacks the leak you measured. Context on how those leaks show up in store reports is in this guide to ecommerce cart abandonment. Then judge SMS only against a holdout group that got no message. Recovery per message sent flatters the channel. Incremental recovery per abandoned checkout proves it.
Where SMS Fits Among Recovery Channels
The channel question is practical. Which path can reach this shopper, and what job should the message do? SMS is fast and hard to ignore. It isn't a full explanation, and it isn't available for everyone who abandoned.
| Channel | Reach requirement | Best role | Main limit |
|---|---|---|---|
| Email address | Detailed reminders with product images | Easily skipped; slower to act on | |
| SMS | Phone number and SMS consent | Short, time-sensitive nudge | Explicit consent needed; short format |
| On-site exit popup | Visitor still on site | Catch exits before checkout | Reaches only present visitors |
| Push notification | App or browser opt-in | Reminders for app users | Requires opt-in before any message |
| Retargeting ads | Pixel and audience | Reach anonymous visitors | No direct contact; paid per click |
Email carries images and a longer reason to return, and many people skip it. An exit popup only works while the visitor is still on the site. Push needs an earlier opt-in. Retargeting can touch anonymous visitors, and you pay for the click without a direct conversation. SMS wins on immediacy when you already have a phone number and explicit consent. The format is short, so the text has to answer one objection, not retell the product story.
Put the objection in the text
Shopify's summary of Baymard research reports that 40% of shoppers abandoned because extra costs such as shipping, taxes, or fees were too high. Delivery speed was a stated reason for 20%, and 13% cited an unsatisfactory returns policy. A reminder that only repeats the product name ignores those three.
A cost-led text can read like this: "Your cart is still here. Shipping is $6, or free over $75. Checkout picks up where you left off." A delivery-led text names the window: "Order in the next 4 hours and it ships tomorrow. Your cart is saved." A returns-led text links the policy instead of burying it. Test those informational messages against a discount-led version. Clearing uncertainty can recover the order without giving away margin on a coupon the shopper didn't need.
Run the informational text and the discount text on separate groups. If both beat a holdout, keep the one that protects margin.
Merchants who want this on Shopify without a custom build can use an app such as YipSMS, which offers prebuilt cart and checkout abandonment flows, real-time analytics, and a 14-day free trial. Email, popup, push, and ads still cover the shoppers SMS can't reach.
What Recovery Rates to Expect
Readers want a realistic SMS recovery rate. The verified research here doesn't publish a channel-level or industry-level recovery rate, so there isn't an honest number to copy. Recovery rate means recovered orders divided by abandoned carts that received a message. That ratio still isn't the lift. People return on their own. The lift is the gap between the messaged group and a holdout that got no message.
Report three figures for every channel and every segment. The messaged recovery rate, the holdout recovery rate, and incremental orders. Industry averages by vertical aren't in this research, so compare segments inside your store rather than against a published industry recovery number. A vendor-reported revenue multiple for automated flows versus one-time campaigns is not a recovery-rate target either.
A reporting template
| Segment | Messaged recovery | Holdout recovery | Incremental orders |
|---|---|---|---|
| Identified mobile checkout | Fill after 30-day test | Fill after 30-day test | Messaged orders minus expected holdout orders |
| Identified desktop checkout | Fill after 30-day test | Fill after 30-day test | Same subtraction |
| First-time shoppers | Fill after 30-day test | Fill after 30-day test | Same subtraction |
| Returning shoppers | Fill after 30-day test | Fill after 30-day test | Same subtraction |
Here's an illustrative example, not a benchmark. You have 1,000 identified abandoners. You message 900 and hold out 100. Ninety messaged shoppers buy, and 5 holdout shoppers buy. Messaged recovery is 90 / 900, or 10%. Holdout recovery is 5 / 100, or 5%. Expected buyers in the messaged group, at the holdout rate, are 900 × 5%, or 45. Incremental orders are 90 minus 45, or about 45. Crediting all 90 to SMS would almost double the true lift.
Set a range per segment after one 30-day test, then revisit it each quarter. Replace every placeholder with your own result. Don't import another brand's recovery rate into that cell.
Set Your Recovery Target and Test SMS Against a Holdout
Timing is part of the test, not a guess you lock in forever. Klaviyo's ecommerce SMS guidance recommends an initial text within a few hours of abandonment and a follow-up roughly 48 hours later. Its cited research found that nearly 18% of customers preferred abandoned-cart notifications by SMS. The same vendor reports that automated flows such as abandoned-cart and post-purchase messages can generate up to 30 times more revenue per recipient than one-time campaigns, because they're timely and targeted. That multiple compares flow types. It isn't a forecast for your store.
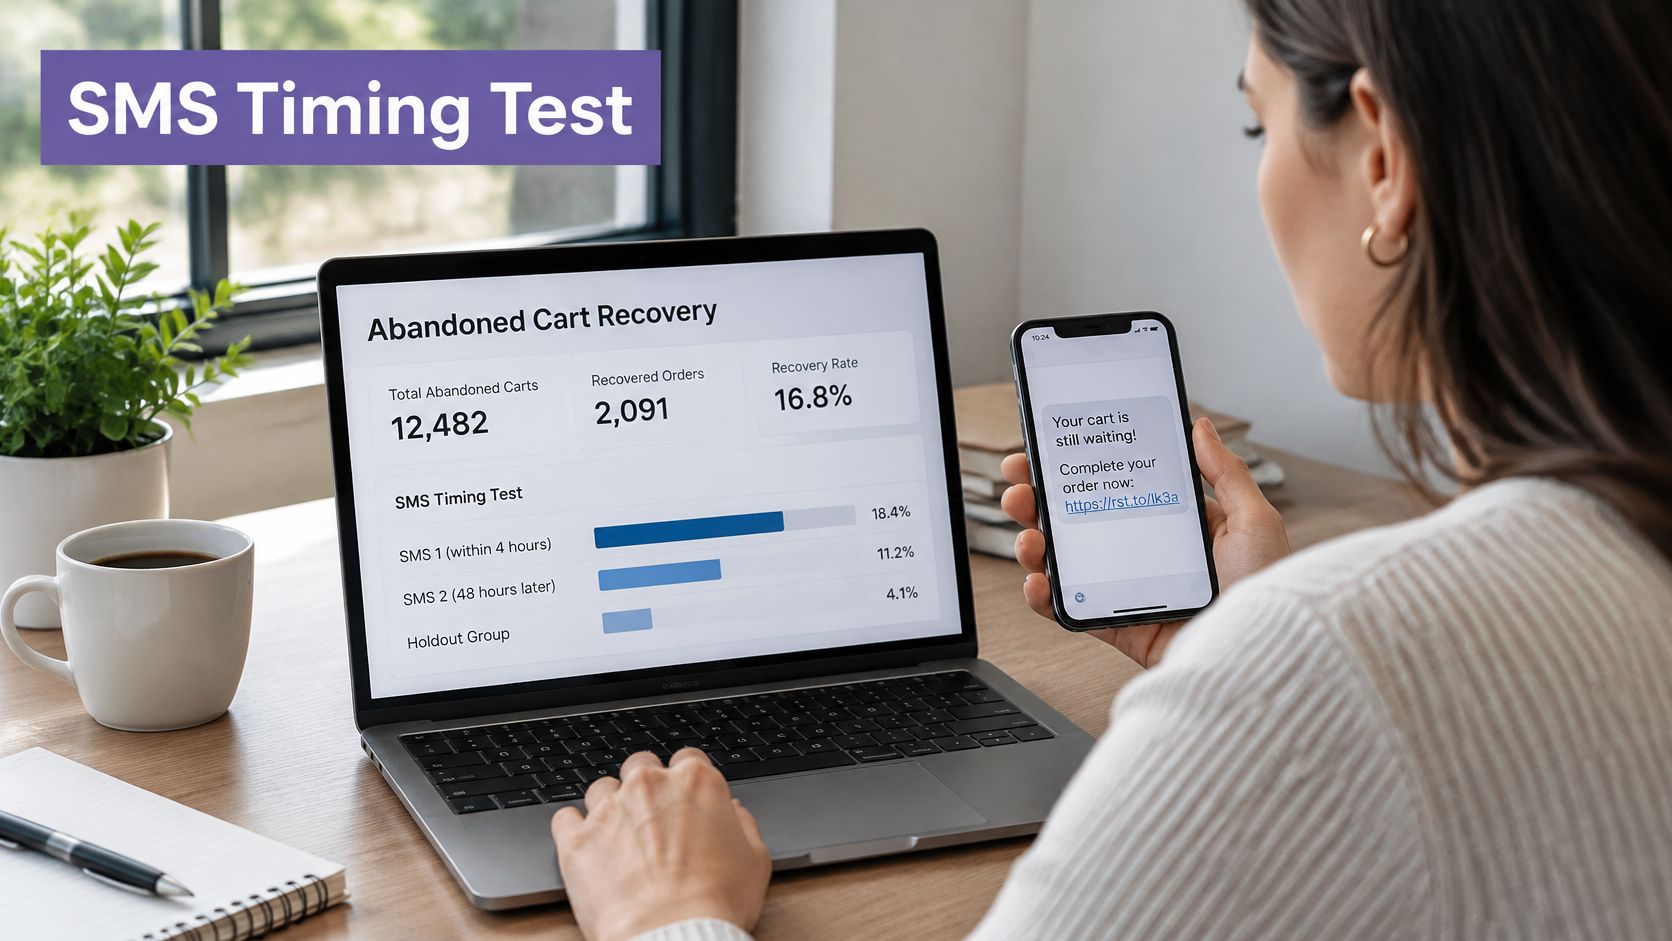
Build the sequence so it stops on its own. A short reminder goes out soon after the exit and states the cost or the delivery answer. A second message goes out around 48 hours later only if no order exists. The flow stops after conversion so nobody gets a redundant text.
Run the 30-day test
- Record the 30-day baseline from the calculation method, split by segment.
- Choose one target per segment, such as identified checkout recovery, rather than one store-wide goal.
- Build the two-message sequence. A few hours after exit, send the cost or delivery answer. Around 48 hours later, send a follow-up only if there's no order.
- Keep a 10% holdout active for the full window. Don't pause it because early results look good.
- At day 30, compare recovered orders and revenue per recipient between the SMS group and the holdout. Count only the difference as incremental. Reading those two metrics side by side is easier with a dedicated view of SMS campaign analytics.
- Keep the messages that beat the holdout. Rewrite or retire the rest.
The up-to-30x figure stays a vendor comparison of flows and campaigns. If your holdout already converts at a high rate, incremental orders can be small even when the messaged group looks busy. That's the result you want to see before you scale spend.
This week, confirm the holdout is set and the first 30-day test is on the calendar before the flow goes live. A live flow without a holdout will keep producing a recovery rate you can't defend.
YipSMS Inc. gives Shopify stores prebuilt SMS flows for cart and checkout abandonment, plus real-time analytics so you can judge recovery against a holdout instead of against messages sent. If you're ready to put a consented, two-step reminder on a 30-day test, visit YipSMS Inc. and start with the segment you can reach.
How this article was made: the YIPSMS team drafts some articles with AI writing tools, then checks pricing, compliance and product details against how YIPSMS actually works before publishing. Spotted something wrong? Tell us through your YIPSMS account.